The following figure represents a Venn diagram that shows the number of students in a class who read any of 3 popular magazines A, B and C. One of these students is selected at random. Find the probability the student reads more than one magazine.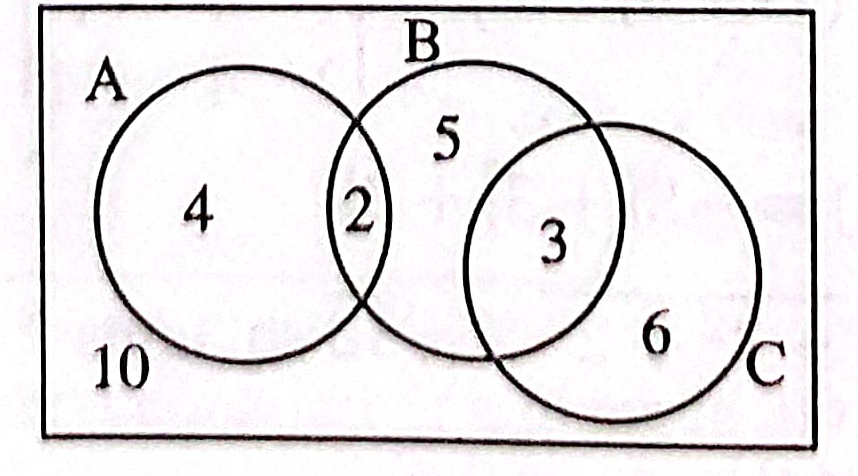
A. 1/7
B.
1/9.5
C. 1/6
D. 1/20
IUTউচ্চতর গণিত দ্বিতীয় পত্রবিস্তার পরিমাপ ও সম্ভাবনাবিবিধ (Topic Practice)IUT - ⚡ অনলাইন প্রশ্নব্যাংক দেখুন 💥

সঠিক উত্তরঃ
C.
1/6
Explanation:

Related Questions (Any University/Year)
- বর্জনশীল ঘটনার জন্য শর্ত কোনটি?
- তিনটি দল I,II,III এর বিভক্ত শিশুদের দলে যথাক্রমে 3 জন বালিকা ও 1 জন বালক,2 জন বালিকা ও 2 জন বালক এবং 1 জন বালিকা ও 3 জন বালক বিদ্যমান আছে প্রতিটি দল হতে নিরপেক্ষভাবে একজন করে নির্বাচিত করা হলে তিনজনের একটি বাছাইয়ে 1 জন বালিকা ও 2 জন বালক থাকার সম্ভাবনা কত?
- একজন চাকুরি প্রার্থী তিনটি ভিন্ন ভিন্ন প্রতিষ্ঠানে চাকুরির জন্য আবেদন করেন। জানুয়ারি মাসের তিনটি ভিন্ন ভিন্ন দিনে তার নির্বাচনী পরিক্ষা হবে এমন সম্ভাবনা নির্ণয় কর।
- কোনো কলেজের একাদশ বিজ্ঞানের মোট 120 জন ছাত্রের 83 জন গণিত,90 জন পরিসংখ্যান ও 60 জন গণিত ও পরিসংখ্যান উভয় বিষয় নিয়েছে। গণিত অথবা পরিসংখ্যান বিষয় দুটির একটিও নেয়নি এমন ছাত্রের সংখ্যা কত?
- কোন ছাত্রাবাসে 60% ছাত্রের ইন্টারনেট ব্যবহারের সুযোগ আছে। 4 জন ছাত্রের একটি দল দৈব চয়নের (Randomly) ভিত্তিতে বাছাই করা হলে কমপক্ষে 0 জন ছাত??রের ইন্টারনেট ব্যবহারের সম্ভাবনা কত?
- নিচের কোন ???ংখ্যাটি দুই বা ততোধিক ক্রমিক সংখ্যার যোগফল হিসবে প্রকাশ করা যায় না?
- A ও B স্বাধীন ঘটনা এবং P (A) = 1/3 ,P(B) = 3/4 হলে P (A U B) এর মান হবে?
- পাঁচজন ছাত্রের মধ্য K, L ও M ছাত্রত্রয় ধার্মিক; M, N এবং R ছাত্রত্রয় সৎ; L, M, N ছাত্রত্রয় বুদ্ধিমান ও K, M এবং R ছাত্রত্রয় পরিশ্রমী। কোন ছাত্র বা ছাত্ররা পরিশ্রমীও নয় আবার ধার্মিক ও নয়।
- নিচের কোনটি পাঁচ সংখ্যার সার এর উপাদান? (Which one of the following is a part of the five-number summary?)
- A sub B sub C হয় তবে A nn (B uu C) = ?
- \( 3.5, -2, -0.5, 1, 2.5, 4 \) এই উপাত্তের পরিসর-
- একটি ক্লাসে 30 জন ছাত্র এবং 25 জন ছাত্রী আছে। নিরপেক্ষভাবে 10 জন ছাত্রছাত্রীকে বাছাই করা হলে 5 জন ছাত্র এবং 5 জন ছাত্রী হওয়ার সম্ভাব্যতা কত ?
- রংপুর শহরে টেলিফোন সংখ্যা 72,73 বা 76 দিয়ে শুরু এবং 6 অঙ্ক বিশিষ্ট হলে মোট সম্ভাব্য সংযোগ সংখ্যা কত?
- A এবং B যে কোন দু‘টি সেট , A'A' এবং B'B' যথাক্রমে A এবং B পুরক সেট হলে , A - B এর সমান হবে ।
- 2,3,3,4 তথ্য সারির গড় ব্যবধান কোনটি?
- 72 কেজি ওজন বিশিষ্ট একটি মিশ্রণ এর 17 ভাগ, B এর 3 ভাগ ও C এর 4 ভাগ নিয়ে গঠিত। মিশ্রণে B কতটুকু আছে?
- যদি সার্বিক সেট Y={0, 1, 2, 3, 4, 5} এবং X={0, 3, 4} হয় তাহলে X এর পূরক সেট X' হবে-
- অধিবর্ষে 53 টি শুক্রবার থাকার সম্ভাবনা কত?
- কটি ইলেকট্রিক বোর্ডে 5টি সুইচ আছে। কত উপায়ে সুইচগুলোকে up এবং down করা যাবে যেখানে 3টি সুইচ up এবং 2টি সুইচ down থাকবে।